Development of a Position & Orientation Sensor for Robotics
by Luke Andrews, Grade 11, Cornwall Hill College, South Africa
Project Overview
Further Developments
Needs Analysis
In robotics competitions, one of the biggest challenges is trying to determine where your robot is on the
playing surface.
It is theoretically possible to determine the position and orientation of a robot using a variety of sensors,
such as light sensors, distance sensors, tachometers, compasses and gyroscopes.
However these sensors often result in inaccurate outputs due to real-life factors. For example:
Wheels slipping would cause tachometers measurements to be incorrect.
Gyroscopes are susceptible to being knocked and losing their calibration.
Magnetic fields in the immediate environment can influence magnetometers.
More expensive sensors combine accelerometers, magnetometers and gyroscopes to generate more accurate
measurements, but only handle orientation, and not the position on the surface.
There is, therefore, a need for a more reliable robotics positioning and orientation system.
Aim
The aim was to test the feasibility of using optical mice for tracking the position and orientation of a robot
relative to the surface in real-time.
Hypothesis
If optical mice could be used to track the movement of a surface below a robot, then it should be possible to
calculate and track the position and orientation of the robot on that surface.
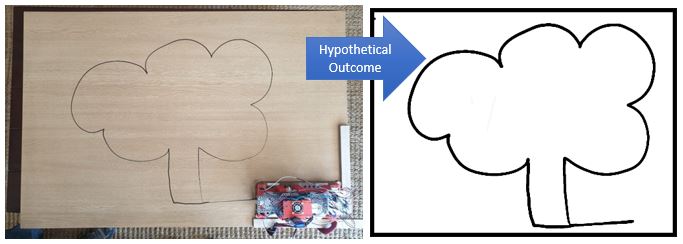
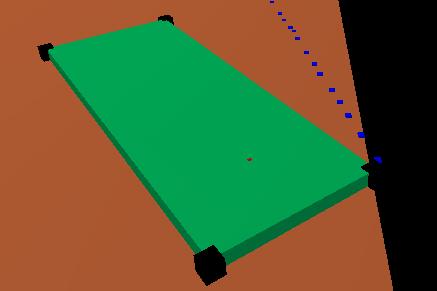
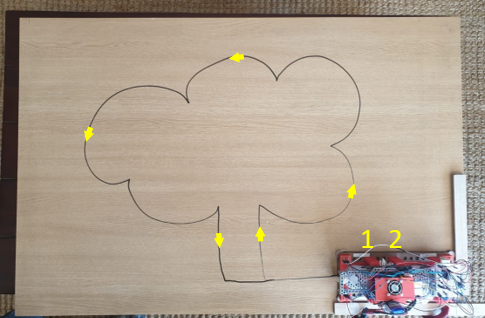
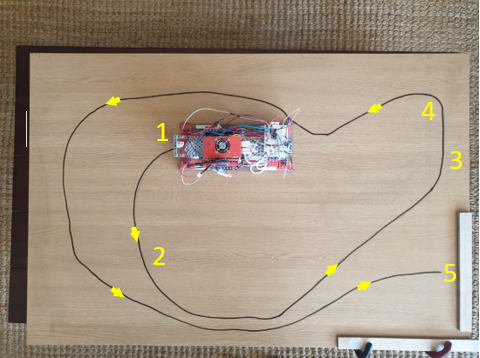
LEFT: Photograph of surface with robot and planned path.
RIGHT: Hypothetical outcome if optical mice can be used to track the robot’s position and
orientation.
Design Goal
The goal was to design, build and test a prototype that would demonstrate the feasibility of using surface
tracking to determine a robot’s position and orientation.
Using only two optical mice for tracking, and distance sensors to verify and correct the measurements based on
detected edge positions, the prototype should be able to accurately determine a robot’s:
Position on the surface,
Orientation relative to the surface
The prototype was not intended to replace other types of sensors, but to create an additional tool that could be
used together with them.
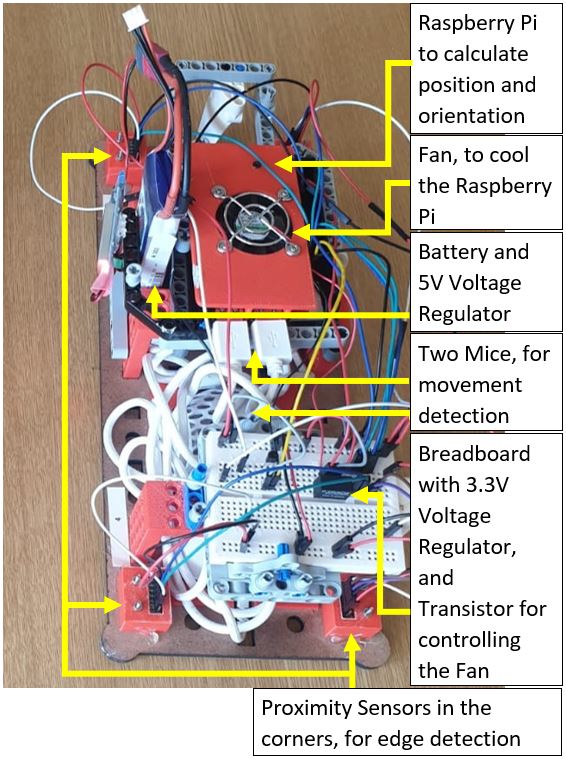
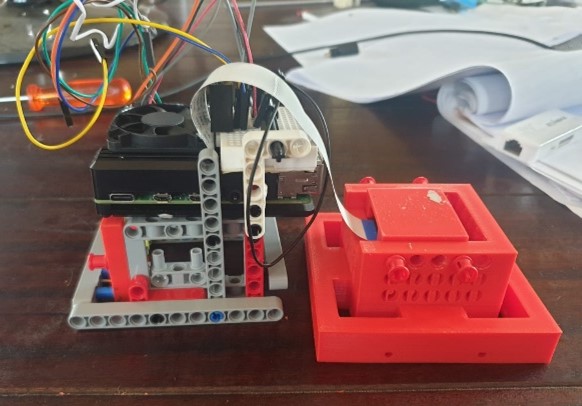
Prototype Hardware Components
Raspberry Pi
Battery
Fan
Breadboard
Surface distance sensors (using reflected light)
Optical mice
Voltage regulator
Transistor
3D printed parts
Gaming console controller
Construction & Testing Procedure
Multiple sensors and algorithms were tested during the development and construction process:
Tests were conducted using two types of distance sensors to detect whether they were above the surface, or
over the edge.
Tests were conducted using three different types of mice to determine which allowed the most accurate
tracking of the device.
Algorithms were created and tested for correcting the movement and angle of the robot.
Combinations of the algorithms above were tested on a sample of 15 paths to determine whether they were
beneficial.
The final prototype was constructed combining the best sensors and algorithms.
Tests were conducted to determine the accuracy of the prototype.
Diagnostic tools were used to review and interpret the results.
Prototype Design
Top of prototype design
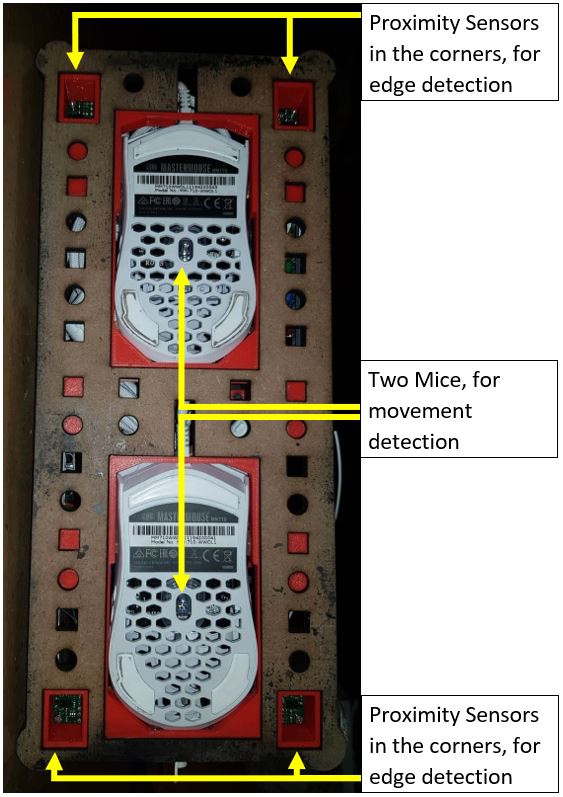
Bottom of prototype design
Diagnostic Tools
Several tools were used for analysing results during the development and testing of the prototypes:
R Analytics
The R programming language was used to analyse and visualise data collected by the prototype. ggplot2
and dplyr libraries were extensively used while analysing the data. Data could either be imported into R
from a CSV file or read from a socket in CSV format.
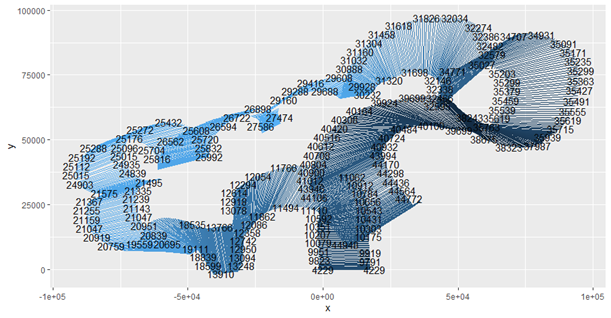
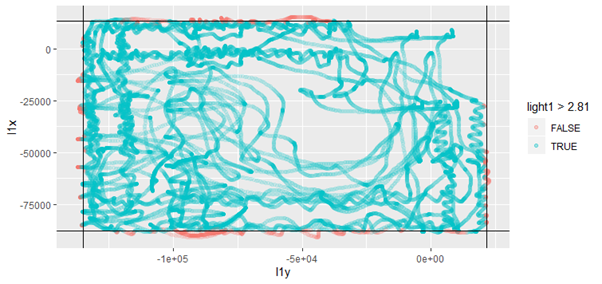
Various functions were created to generate commonly-used graphs, such as the one below, showing the path
followed and orientation of the robot.
Example of a calculated path and orientation displayed using function created in R.
Graphical Output Display
A graphical interface was created, allowing data to be visualised in 3D in real-time, or to be stepped
through, to examine each movement.
The graphical display is written in Java, using OpenGL, and is run on a PC. Navigation is achieved
either using a PC keyboard or via a game controller.
Data can either be received in real-time through a socket or read from a file.
The graphical displays the following information:
Position of the robot relative to the surface
Orientation of the robot
Position of the proximity sensors
Proximity sensor readings
Position of the mice
Last 40 edge events
Example of graphical interface showing a line of edge events
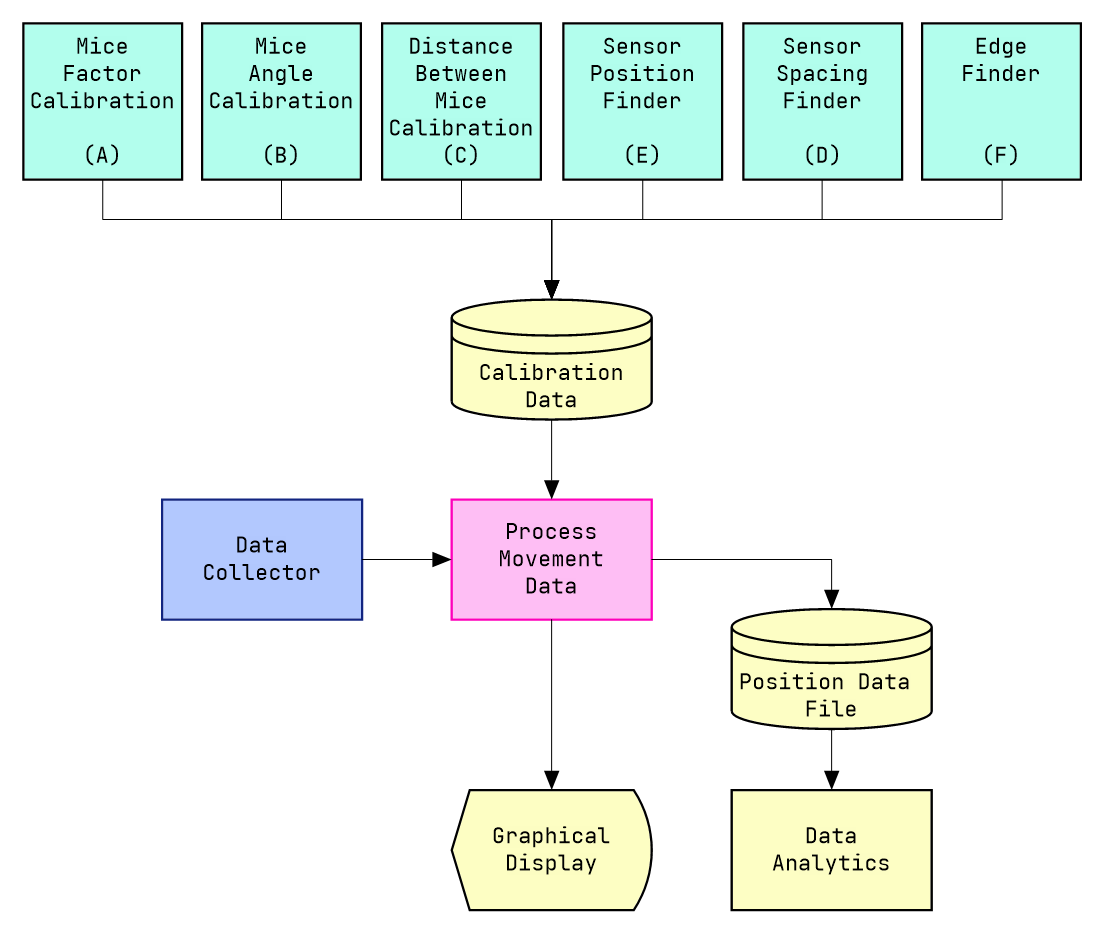
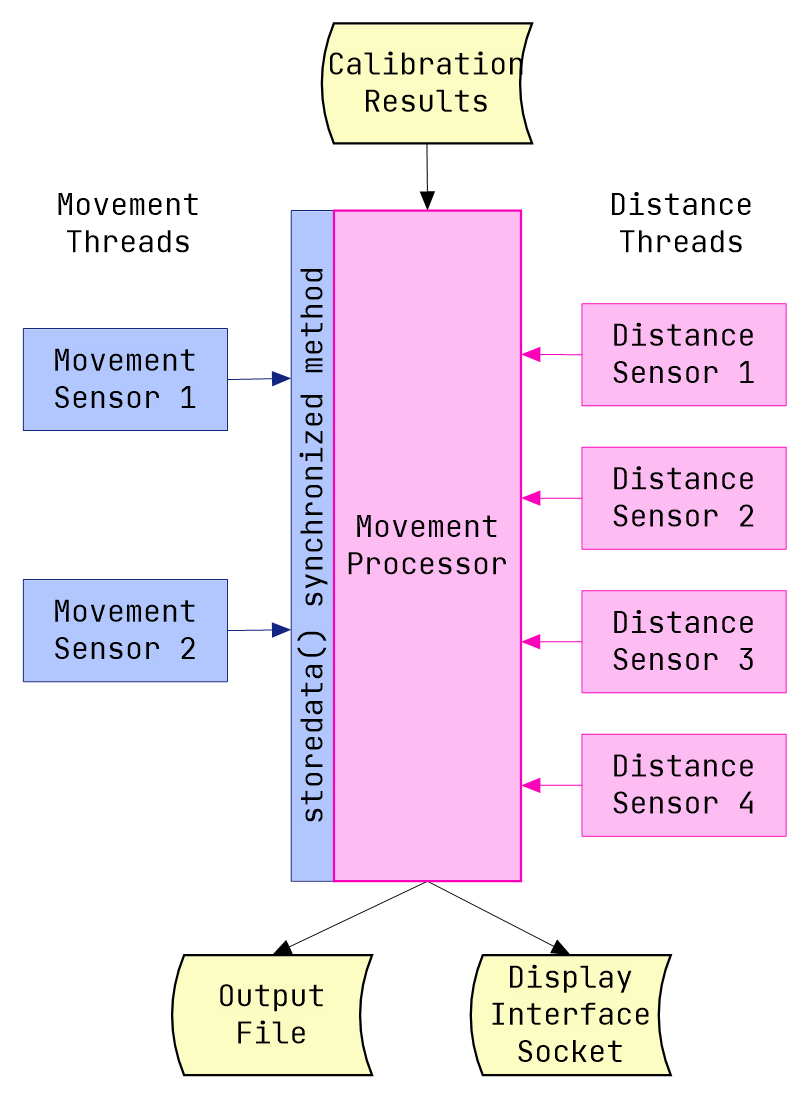
Software Architecture
Data from the sensors and mice was collected on the Raspberry Pi. Readings were adjusted based on
calibration data and combined to calculate the robot position and orientation.
Processed data could be analysed using R, or visualised using the graphical interface.
Overview of Raspberry Pi interface.
Calibration Process
Six calibrations are required to determine the position and orientation of the mice sensors and the position of
the surface-edge sensors.
The calibration process was performed by collecting multiple sets of data and analysing it to calculate the
position and sensitivity of the sensors and surface.
Calibration Method
On the final prototype, data collected was analysed using trigonometry and mathematical equations.
All calibrations are stored in a calibration file on the Raspberry Pi, which is accessible to the data collector
and graphical display through a web server on the Raspberry Pi.
Mouse Factor Calibration (A)
The ratios between the two mice readings is calculated after moving the robot forwards, backwards, left and
right equal distances in straight lines in the 4 directions, with sideward movement being perpendicular to
forwards.
Mouse Angle Calibration (B)
Using the data collected during the Mouse Factor Calibration, the amount of sideward movement detected
on the forwards and backward movement was used to calculate the angle of each mouse relative to the
chassis.
If the rotation of the mice is not applied to the measurements, the robot would appear to move in an arc
when moving in a straight line.
Distance Between Mice Calibration (C)
The distance between the mice is an essential factor when determining whether the robot has turned, and by how
much. By turning the robot 360° in each direction multiple times and recording the sideways movement of each
mouse, it is possible to calculate the distance between the mice.
Sensor Spacing Finder (D)
The distance between the sensors on each side is vital to be able to determine the position of the sensor. It is
possible to determine the distance between the sensors on each side by moving the robot along an edge where a
small bracket is attached, and recording the robot position when the sensors pass over the bracket.
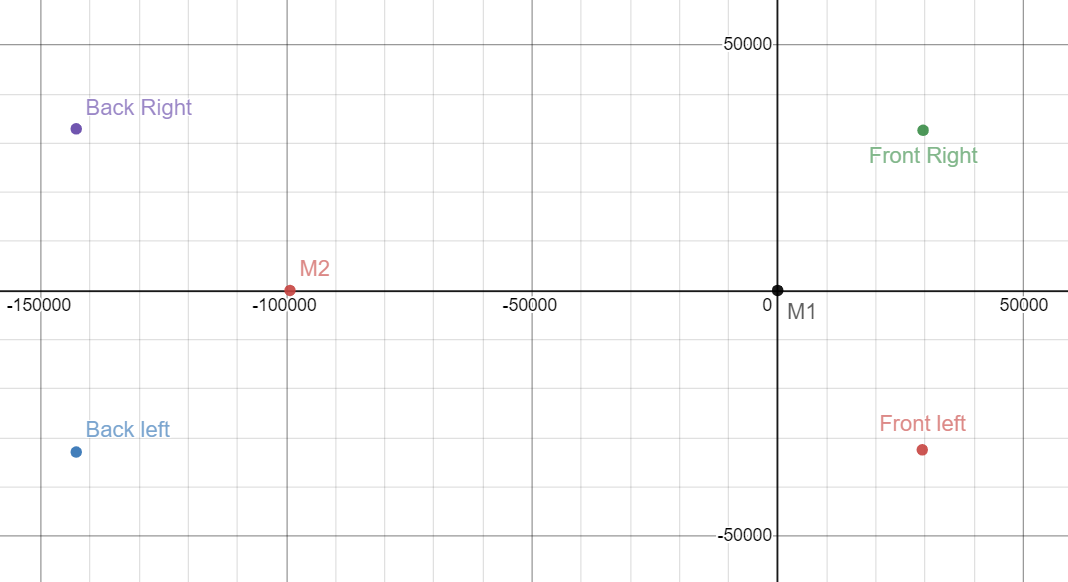
Sensor Position Finder (E)
The robot was moved over the edge of the table four times (backwards, left, forwards, right). If the
mouse sensor is precisely centred between the two side sensors, then the distance of each sensor from
the mouse is equal.
It was possible to determine the distance of each sensor relative to the mouse, on the X and Y-axis, by
combining this information with the distance between the sensors.
Graph showing calculated mouse and sensor positions
Edge Finder (F)
Determining the edges of the surface was based on the assumption that the surface is rectangular, and
that the robot always starts in the same position. This calibration merely involves driving to each
edge, taking into consideration all of the previous calibrations. The position of the robot, and the
sensor relative to the robot when the sensor detects an edge, allows the position of the four edges to
be determined relative to the starting position of the mouse.
Example of recorded robot positions after following each edge, showing the position of
the edges
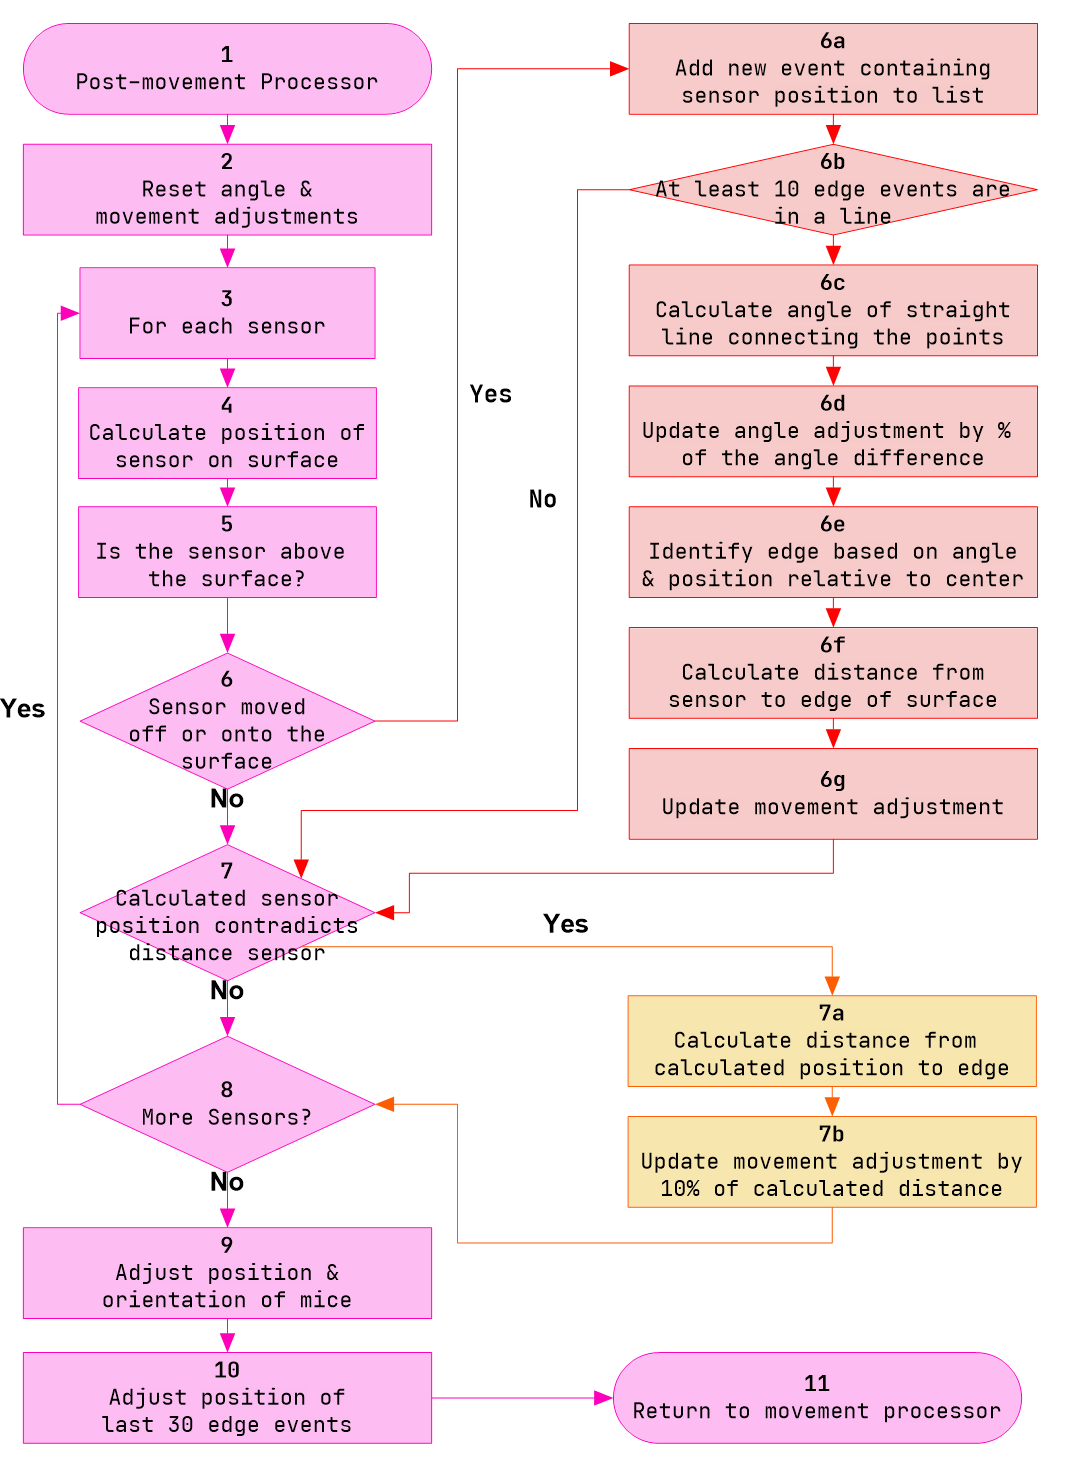
Movement Processing
The movement processor calculates position and orientation using mouse readings and calibration data. Distance
sensors detected edges for adjustments.
Overview of processing inside the Raspberry Pi
Overview of the movement adjustments
Angle and Position Manipulation
Early prototypes used trigonometry to calculate chassis angles and the positions of the sensors on the
surface.
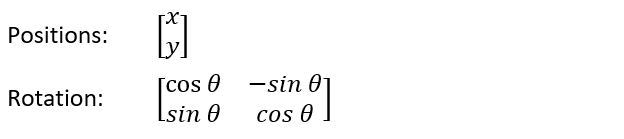
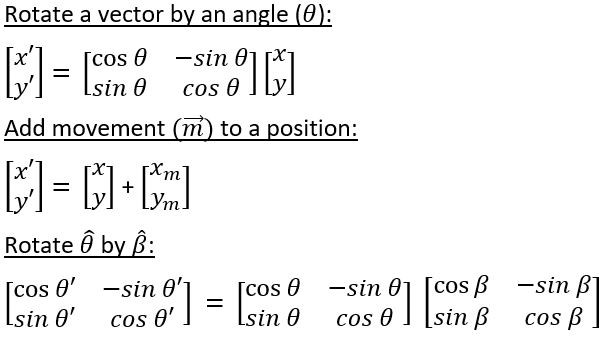
The final prototype used matrices as follows:
Using matrices, the following operations were possible:
In the final prototype, all angles, positions and movements were stored in matrices. Orientation was only
converted into an angle for display purposes, using the cos and the sin of the angle from the rotation
matrix.
Testing and Results
Methodology
Multiple tests were conducted to determine the accuracy of the final prototype.
The following process was followed:
A pattern was drawn on the surface.
The starting position of the robot was specified.
The pattern was followed by the robot while recording the path taken.
Where possible, the difference between the starting and ending angle was recorded.
Data was analysed in R and compared to the pattern to determine the accuracy.
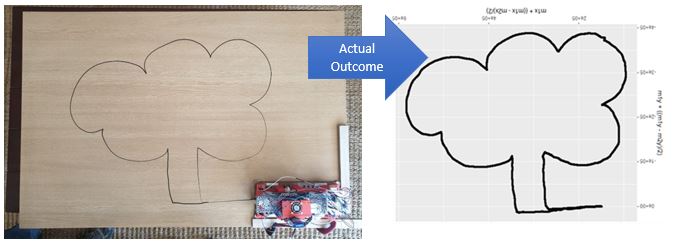
For each test, a photograph was taken showing the actual starting position of the robot, and the path to be
followed. Results were recorded and plotted on a graph. The graph was overlaid over the photograph to determine
the accuracy.
Known Start Position & Orientation Test
Wooden surface with the robot and
planned tree path
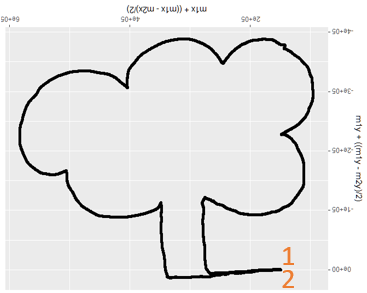
Calculated outcome path of tree
This test aimed to follow a curved line in the shape of a tree. The following was observed:
1
The robot was started at known position and orientation.
2
The final position of the robot was 0.33° from the starting orientation, and the path recorded was
almost identical to the planned path.
Incorrect Start Orientation Test
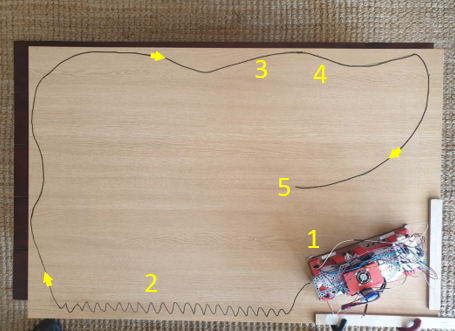
Wooden surface with the robot and
planned edge-follow path
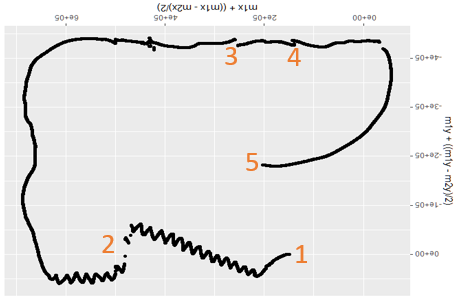
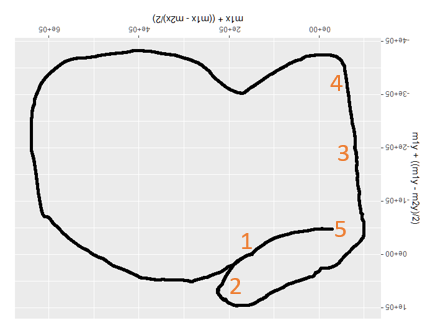
Calculated outcome path of edge following showing position and angle adjustments
The aim was to determine whether the robot could automatically correct its position when starting in an
incorrect position with an incorrect orientation. The following was observed:
1
The robot was intentionally started at incorrect orientation.
2
The orientation was corrected based on the known position of the surface edge.
3&4
The position was corrected based on the known position of the surface edge.
5
The final robot’s calculated orientation & position matched the actual orientation & position.
Incorrect Start Position Test
Wooden surface with the robot and planned circular path.
Calculated outcome path of the circular path showing position adjustments
This test aimed to determine whether the robot could automatically correct its position on the surface when
starting at a known angle but an unknown position. The following was observed:
1
The robot was intentionally started at an incorrect position.
2&3
The position was corrected based on the known position of the surface edge.
4-5
After recalculating its position from 2&3 the calculated positions match the actual positions.
Discussion of Results
Thousands of tests were conducted during the development of the prototype. During the development and testing,
results were significantly improved by:
Fixing the positions of the mice and sensors to produce consistent readings.
Compensating for the positions of the sensors.
Compensating for the positions and orientations of the mice.
Improving the position and orientation correction algorithms.
Sensor accuracy over time
Gyroscopes tend to drift over time. Some more expensive gyroscopes use a compass to recalibrate themselves.
Without a static reference, such as the earth’s magnetic field, it is almost impossible for any sensor to remain
accurate. This sensor is no exception. It will, over time, become less accurate.
The prototype automatically re-aligns itself when it detects an edge, both in terms of position and orientation,
to compensate for this drift. As long as the angle remains within 25° of the actual angle, it can correct its
orientation when it identifies an edge on the surface.
Testing Limitations
Measuring the accuracy of the readings is difficult due to the infinite number of possible routes and
orientations.
The finishing orientation and position are not necessarily an indication of the accuracy of the path followed.
Conclusion
The design goal was achieved. The prototype was able to calculate the position and orientation of the robot on
the surface, in real-time, using data obtained from two optical mice, and adjust this information based on
observations from the distance sensors.
LEFT: Surface with robot and planned path. RIGHT: Path recorded by robot following
the path on the left.
Ongoing Investigations
The following ideas were tested:
Lenses with the mice so that they can be mounted above the surface.
The use of a standard Raspberry Pi Camera or high-resolution Raspberry Pi Camera instead of using mice.
Ongoing Development
After investigating various alternatives, it was decided to develop a sensor using a Raspberry Pi v2
Camera. A dedicated Raspberry Pi was added to analyse and process two sections of each image to emulate
two mice.
Tests showed that it was possible to capture 950 small images per second and analyse them in real-time.
Tests using a single camera were not as accurate as using two separate mice because the images were only
11mm apart.
The next prototype will include two of these camera sensors, one on each end of the robot. This should
produce similar results to the mice, with the advantage of being mountable on a moving vehicle.
Raspberry Pi Camera testing
Future Improvements
The following improvements will be tested:
The ability to interface it back to EV3 (serial or I2C).
A magnetometer to determine the initial angle.
Position corrections to cater for differently shaped surfaces.
Acknowledgements
I would like to thank the following people & organisations who inspired this project and made it possible:
Pieter Pretorius for introducing me to robotics.
CJ Chung, Ph.D, Robofest Founder and Director for his encouragement.
IMBEWU Science Foundation for their guidance and assistance.
Mrs van Niekerk for teaching me about trigonometry.
Matthew Andrews for teaching me about matrices.
Codecademy for their free programming courses.
Downloads
The following documents are available for download by authorised users: